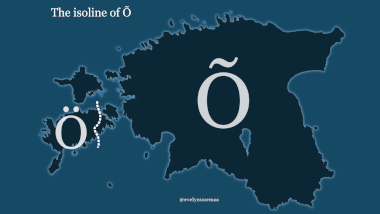
Day 30 - A mapped - The isoline of Õ
For the map I decided to make a very simple map about the isoline of Õ. One of the coolest peculiarities in Saaremaa dialect is that instead of Estonian vow...
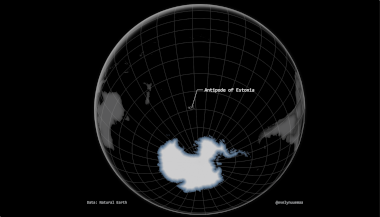
Day 29 - Globe - Antipode of Estonia
Everyone knows where Estonia is on the globe but how many of you know that the antipode of Estonia is in the middle of nowhere? Finding a geographic point’s ...
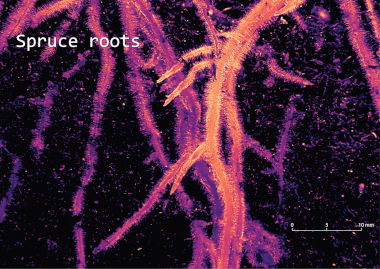
Day 28 - Non-geographic - Roots
The hidden life below-ground. Roots are the back-bone of life and biodiversity below-ground. Data collected by an awesome team Ivika Ostonen-Märtin and Maril...
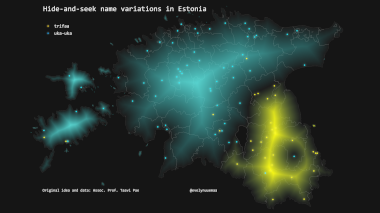
Day 27 - Small data - Hide-and-seek
Hide-and-seek or actually the very correct name in English would be “kick the can” is a game that every Estonian has played in their childhood in long warm s...
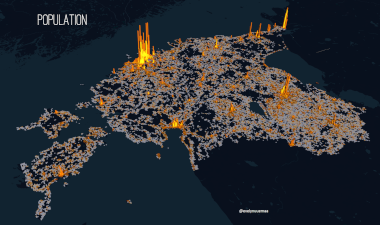
Day 26 - Map with a new tool - Population in 3D
Map with a new tool and I made just another population map with Kepler.gl. This was more simple than I thought :)
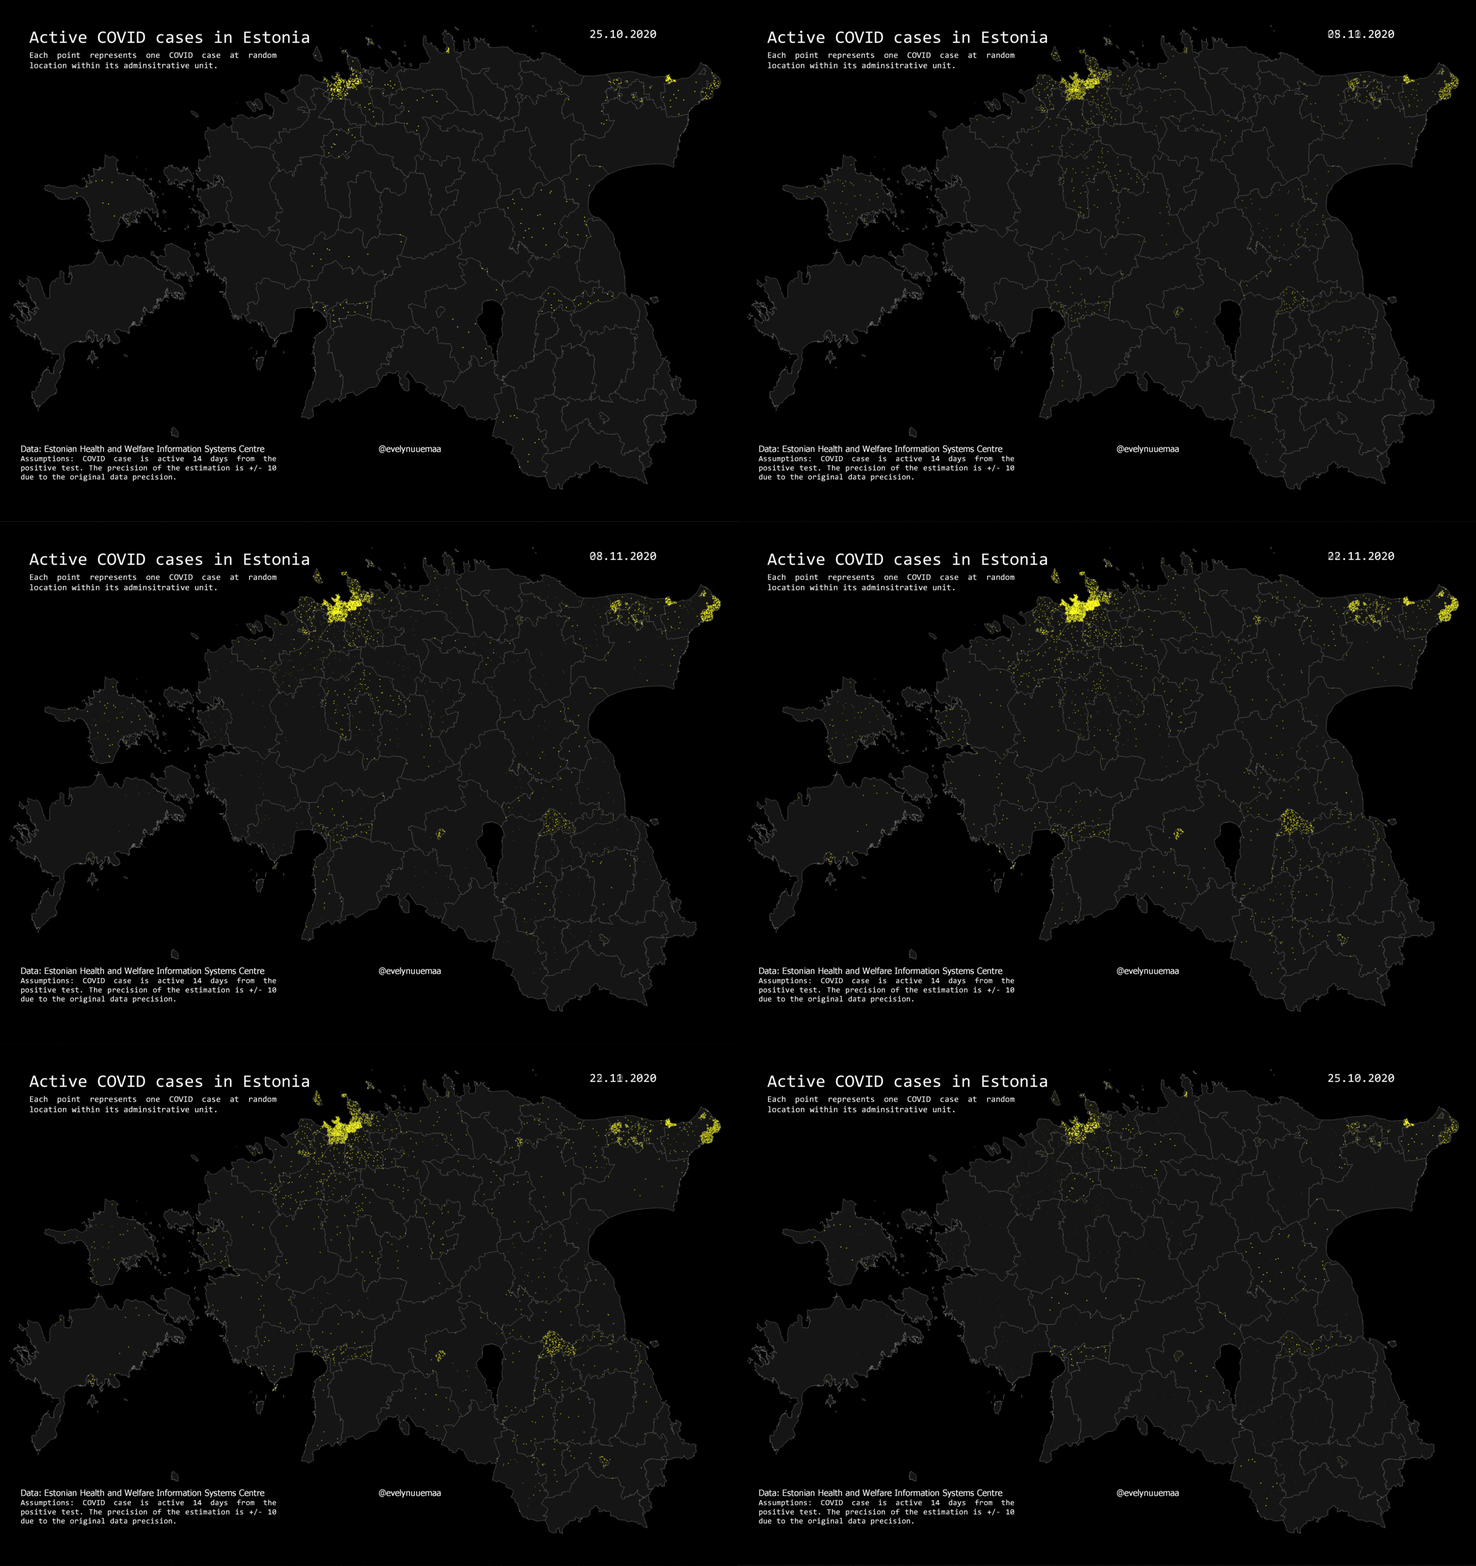
Day 25 - COVID - COVID cases in Estonia
Active COVID cases in Estonia mapped as individual random points in the administrative units. I guess this illustrates a bit how likely you are to bump into ...
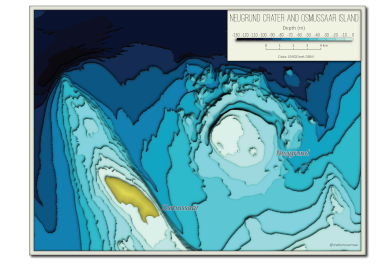
Day 24 - Elevation - Bathymetry of Neugrund
The bathymetry around Osmussaar island and Neugrund meteorite crater. Neugrund is the biggest meteorite crater of Estonia and one of the best–preserved marin...
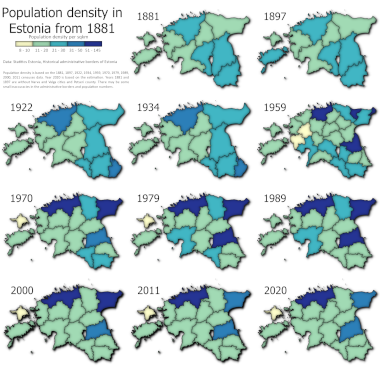
Day 23 - Boundaries - County borders and population through time
The change of the county level boundaries and population density from 1881 to 2020 in Estonia according to census data. In the original Twitter post, the bou...
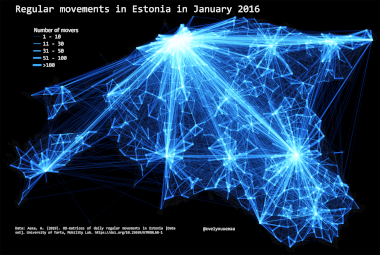
Day 22 - Movement - Regular movements in Estonia
Regular movements between Estonian territorial communities in January 2016.
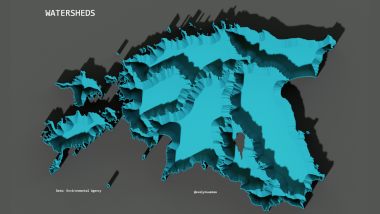
Day 21 - Water - Watersheds
Estonian watersheds mapped as bowls.
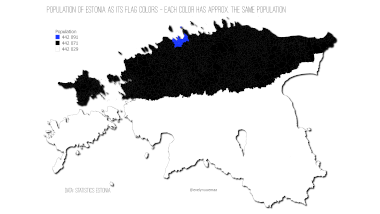
Day 20 - Population - Population of Estonia as its flag
Population of Estonia mapped as its flag colors - each color has approx. the same.
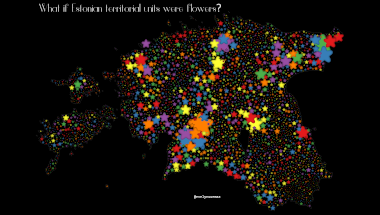
Day 19 - NULL - Absolutely useless but fun map
The topic was missing data and when you don’t have data then you map just nonsense :P Estonian territorial units mapped as flowers.
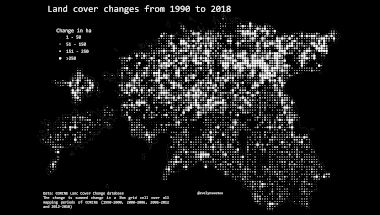
Day 18 - Landuse - Land use and land cover changes in Estonia
Land use and cover changes from 1990 to 2018 in Estonia summed over the years into 3km grid based on CORINE land cover change database. Quite clear differenc...
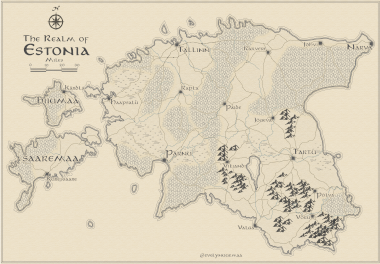
Day 17 - Historical - Estonia in Lord of the Rings Style
Lord of The Rings style Estonia that looks historical style, although is a fantasy. This map has been created already before, so a little bit of cheating ;)
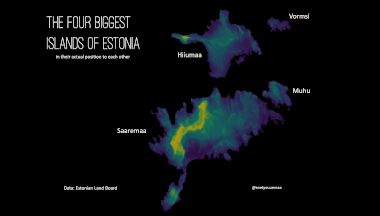
Day 16 - Islands - Four biggest islands of Estonia
Elevation of the four biggest islands of Estonia in their actual position to each other.
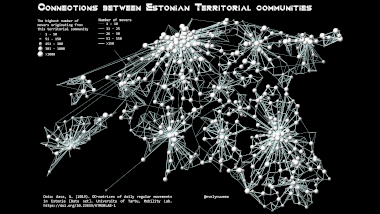
Day 15 - Connections - Temperature Anomaly
Connections between Estonian territorial communities based on the regular movements in January 2016.
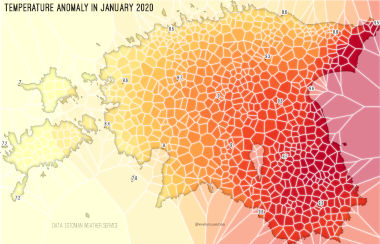
Day 14 - Climate change - Temperature Anomaly
January 2020 was super warm in Estonia and the temperature anomaly was almost up to +10 degrees compared to the long-term historical average. These anomalies...
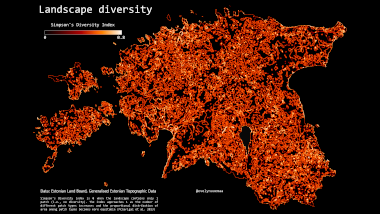
Day 13 - Raster - Landscape Diversity
Landscape diversity by Simpson’s Diversity Index calculated in Fragstats on Estonian generalised topographic database land use data.
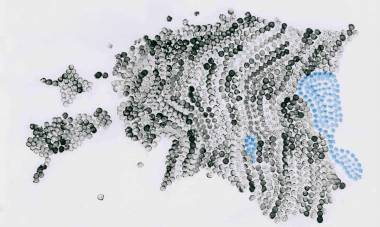
Day 12 - Not made with GIS software - Shape of Estonia
The task was to create a map with non GIS software and I chose very traditional way and painted Estonia with water colors.
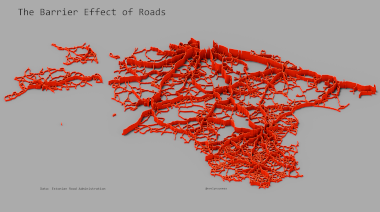
Day 11 - 3D - Traffic density
Estonian road traffic density mapped as 3D which visualizes them as barriers.
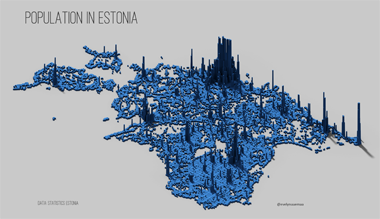
Day 10 - Grid - Population in 3D Grid
Estonian population in 1km mapped in 3D. The original map was made in grayscale in QGIS and imported to Aerialod which ertrudes based on the color.
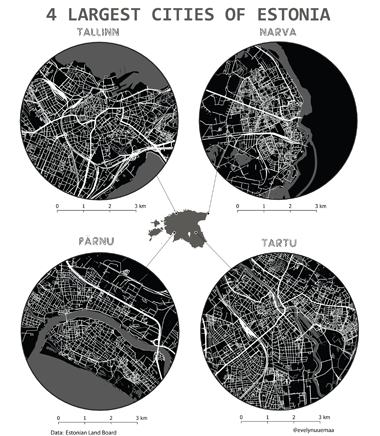
Day 9 - Monochrome - 4 largest cities of Estonia
Four largest cities of Estonia mapped in a 3km-radius buffers.
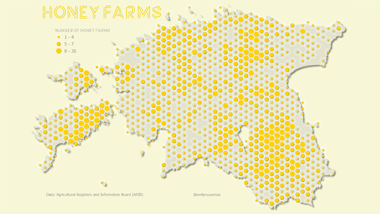
Day 8 - Yellow - Honey farms in Estonia
Honey farms in Estonia visualised as a count in the hexagons.
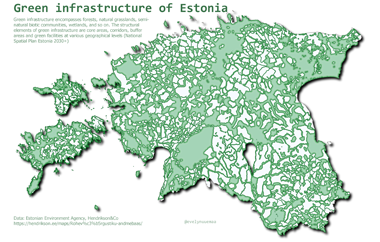
Day 7 - Green - Green infrastructure of Estonia
The green infrastructure strategy aims to preserve or re-create a system of functioning green areas and facilities that are cohesive and sufficiently compact...
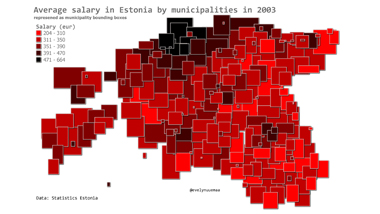
Day 6 - Red - Average salary in Estonia by municipalities in 2003
Average salary in Estonia by municipalities in 2003. Who remembers their salary almost 20 years ago? It was sooooo small :O The municipalities are represent...
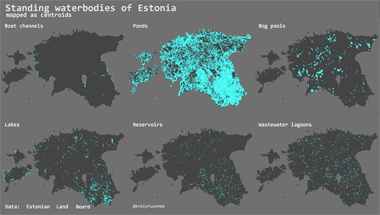
Day 5 - Blue - Standing waterbodies of Estonia
Standing waterbodies of Estonia mapped as centroids. What can I say – every Estonian has to have a pond?
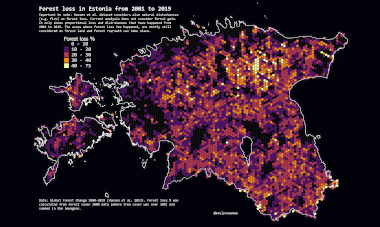
Day 4 - Hexagons - Forest loss in Estonia
4.Hexagons: Forest loss in #Estonia from 2001 to 2019 based on #GLobalForestChange data. The analysis was done for 3km hexagons. Forest loss was summed for e...
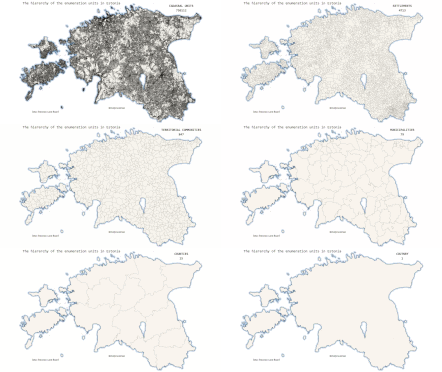
Day 3 - Polygons - The hierarchy of the enumeration units in Estonia
The hierarchy of the enumeration units in #Estonia starting from the smallest: cadastral units (katastruüksused), settlements(külad, linnad, alevid), territo...
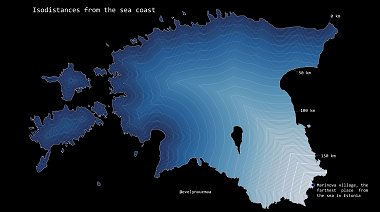
Day 2 - Lines - Isodistances from the coast
Isolines are very efficient way to map quantitative data as lines. The current map is representing 1km-isodistances from the Baltic sea. The farthest village...
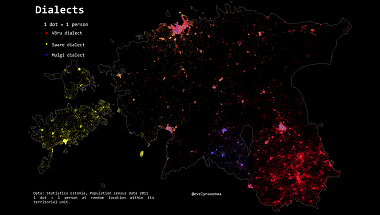
Day 1 - Points - Dialects
The first day challenge is points. I mapped three most widely spoken dialects in Estonia: Võru, Saare, Mulgi mapped as dots. 1 dot is marking 1 person speaki...
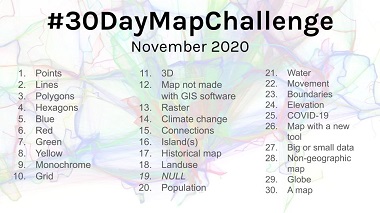
Day 0 - MapChallenge Categories
Topi Tjukanov announced the 30 Day Map Challenge for the first time in November 2019. This is the second year of the challenge. Last year I managed to do all...