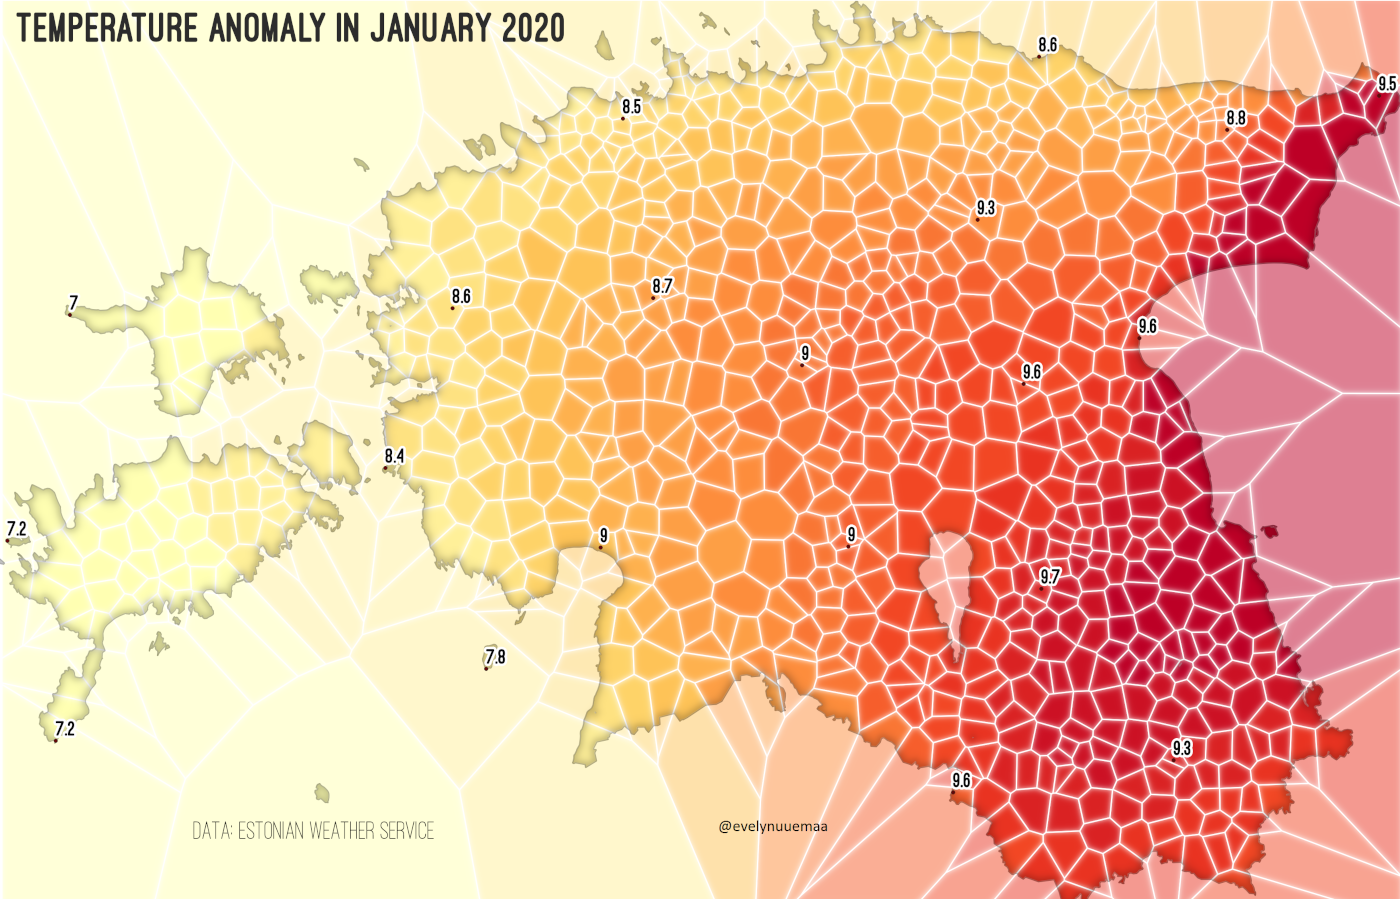
January 2020 was super warm in Estonia and the temperature anomaly was almost up to +10 degrees compared to the long-term historical average. These anomalies are becoming a norm, unfortunately.
Methods: I interpolated the temperature anomalies and averaged the values from the interpolated raster to voronoi polygons that were generated based on territorial communities’ centroids.
Used tools: QGIS Data: Estonian Weather Service