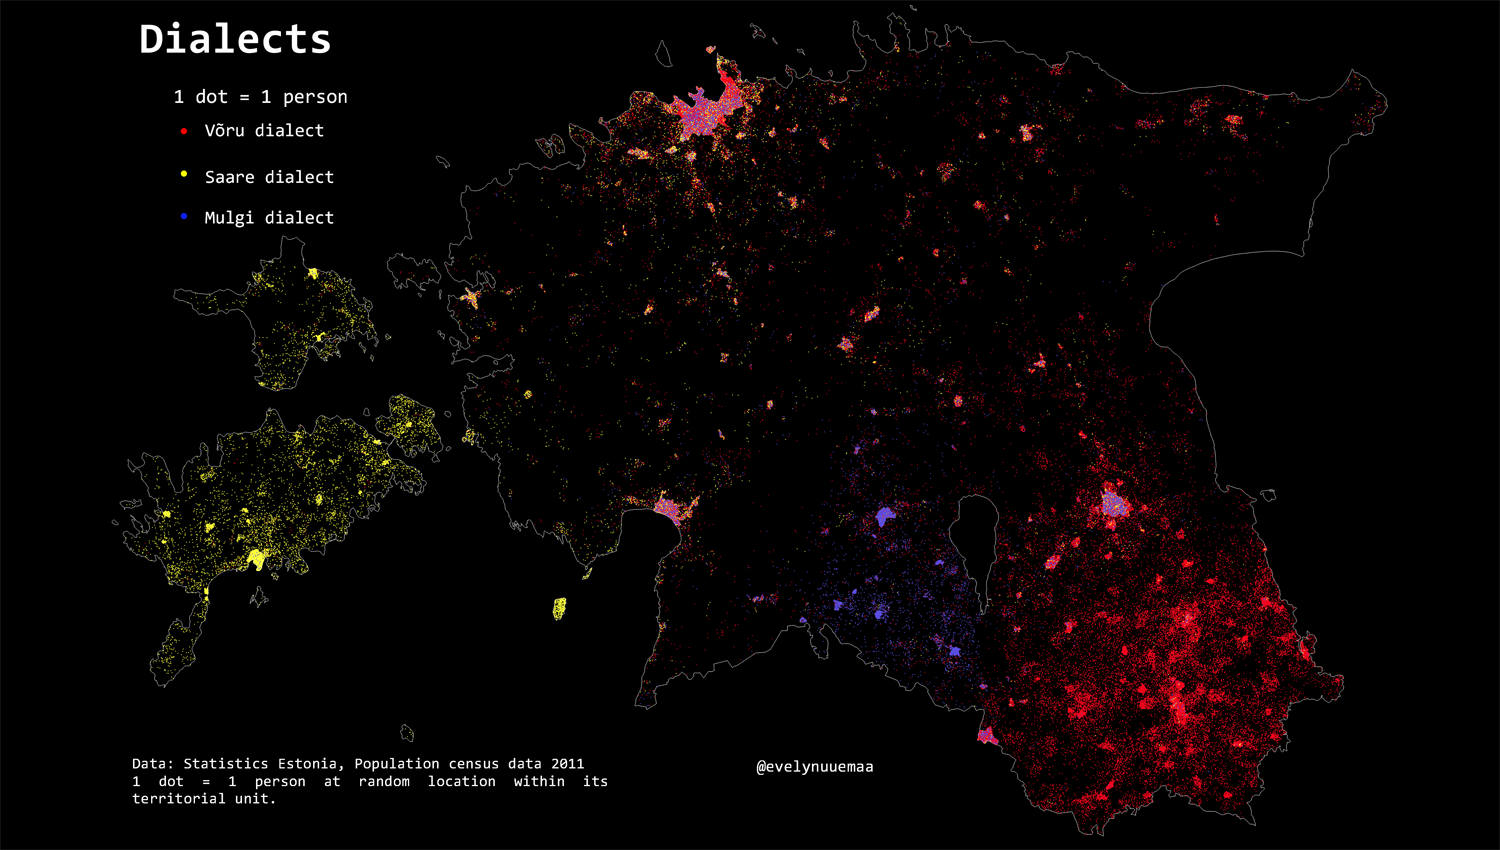
The first day challenge is points. I mapped three most widely spoken dialects in Estonia: Võru, Saare, Mulgi mapped as dots. 1 dot is marking 1 person speaking the dialect according to the year 2011 census. The cities have too many points and therefore some visual bias is present as points are covering each other. But you get the point where the dialect originates :)
Methods: I used territorial unit (village) level census data from 2011. Random points inside polygon tool was used in QGIS to generate random points based on the number of people speaking the dialect in each territorial unit and visualised by color.
Data: Statistics Estonia
Tools: QGIS