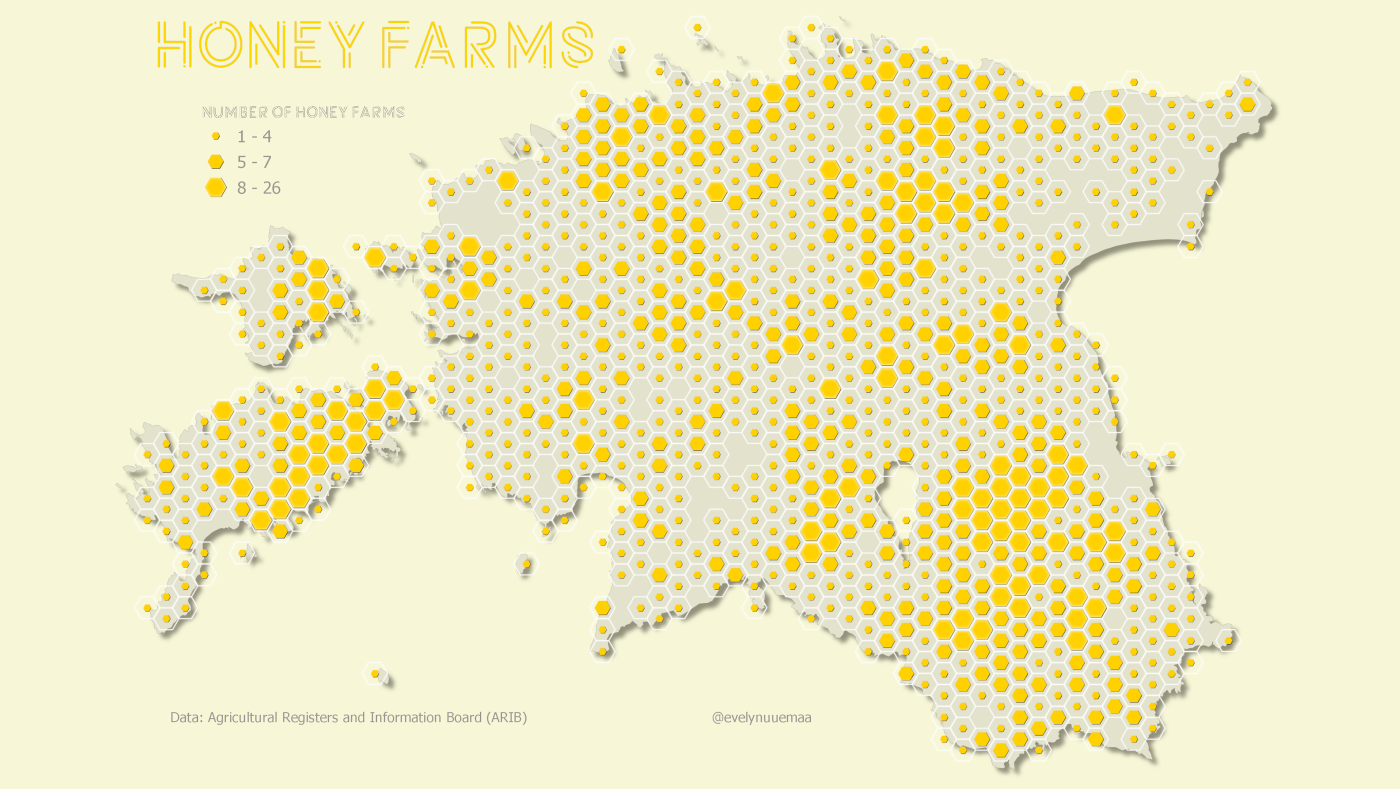
Honey farms in Estonia visualised as a count in the hexagons.
Methods: The different size of the hexagons was achieved by using a centroid fill and marker symbol for every hexagon and data driven symbology based on the number of the farms. Shadow effect was applied by using the Draw effects. Font Potra Light
Data: Agricultural Registers and Information Board (ARIB)
Tools: QGIS